
By Dr. Muhammad Awais Rabbani, MBBS · Medically reviewed by Dr. Ahmed Humayon, MBBS · Updated 29 October 2026 · Editorial policy
Body fat percentage is the share of a man’s weight that is fat. The American Council on Exercise (ACE) rates 14–17% as fit, 18–24% as average and 25% or more as obese. Enter your neck, waist and height below.
US Navy tape method — result shown with its error range
Runs in your browser. Nothing you enter is sent or stored.
Body fat percentage calculator for men (US Navy method)
This body fat calculator uses the US Navy method, built on the Hodgdon–Beckett equation, to calculate body fat for men from three tape measurements: height, neck and waist. It returns a point estimate, an error band of ±3.5 percentage points either side, and your fat mass and lean mass in pounds or kilograms.
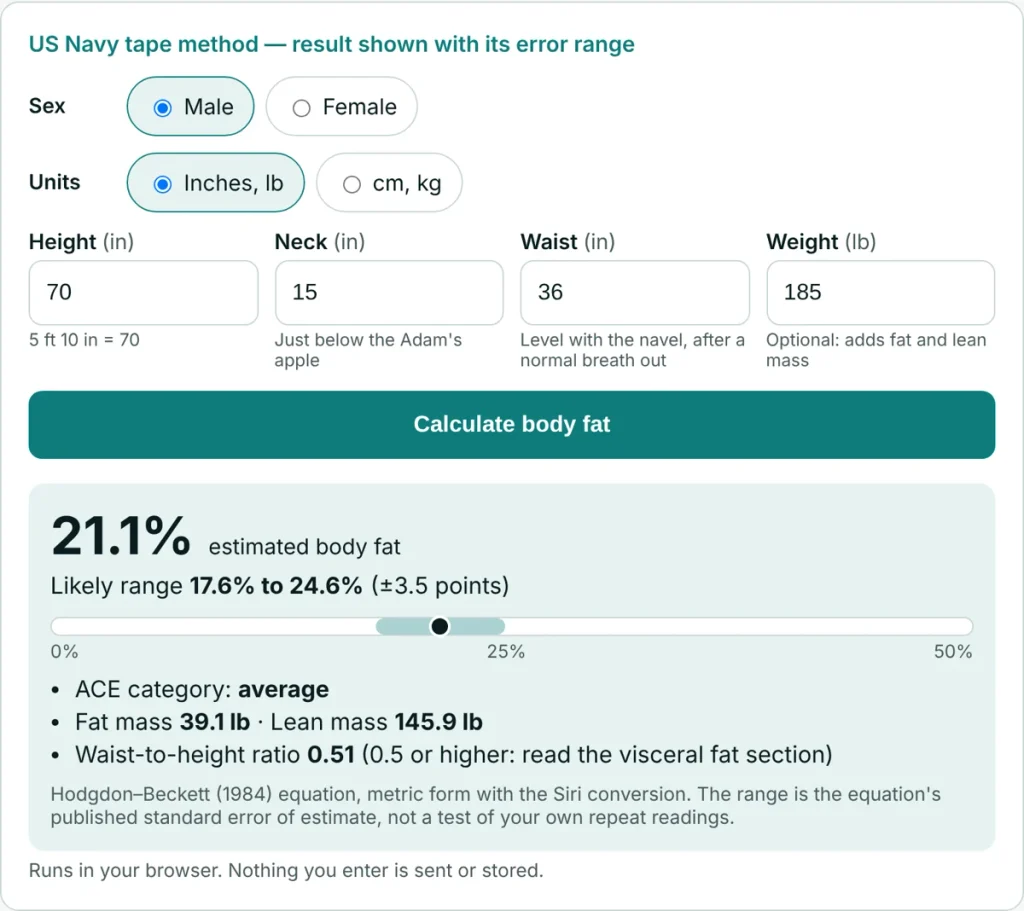
Example result (the worked example below) Estimated body fat: 21.1% · likely range 17.6% to 24.6% Fat mass 39.1 lb · Lean mass 145.9 lb · ACE category: average
The range is the equation’s standard error of estimate (SEE), 3.52 percentage points in the 602 Navy men it was built on (Hodgdon & Beckett, 1984).
Lean mass is the number the Katch-McArdle formula runs on, so you can turn your lean mass into a calorie and protein target.
Measure the same way each time. The band covers the gap between one reading and a lab value. Week-to-week drift is a separate problem, covered under accuracy.
What is body fat percentage for a man?
Body fat percentage, or percent body fat, is fat mass divided by total body weight, multiplied by 100. A 185 lb man carrying 39 lb of fat sits near 21%. Everything else is lean mass: skeletal muscle, bone, organs and water. Together the two make up body composition.
Body fat for men falls into two pools. Essential fat lines nerves, bone marrow and cell membranes and cannot be lost without harm. Storage fat is the adipose tissue under the skin and around the organs, and it rises or falls with the calories you eat against the calories you burn. Body weight cannot separate the two, and two men at 185 lb can carry very different amounts of fat if one has far more muscle mass.
That is why the calculator reports fat and lean mass alongside the percentage.
How the US Navy body fat formula works (with a worked example)
The US Navy formula, published as the Hodgdon–Beckett equation in 1984, predicts a man’s body fat from two inputs: the log of waist minus neck circumference, and the log of height. A larger waist relative to the neck raises the estimate, and greater height lowers it. No scale or skinfold is needed (Hodgdon & Beckett, Naval Health Research Center Report 84-11, 1984).
Metric units (cm), the original density form:
%BF = 495 / (1.0324 − 0.19077 × log10(waist − neck) + 0.15456 × log10(height)) − 450

Inches, the Department of Defense form:
%BF = 86.010 × log10(waist − neck) − 70.041 × log10(height) + 36.76
The metric form predicts body density, then converts it to fat with the Siri equation (Siri, 1961). The inch form was refitted directly to percent fat for DoD Instruction 1308.3, on 594 of the original men, with the same 3.52-point error (Hodgdon & Friedl, NHRC Technical Document 99-2B, 1999).
| Worked example (fictional man) | Inches / lb | Metric |
|---|---|---|
| Height | 70 in | 177.8 cm |
| Neck | 15 in | 38.1 cm |
| Waist (at navel) | 36 in | 91.4 cm |
| Weight | 185 lb | 83.9 kg |
| Body fat estimate | 21.3% (inch form) | 21.1% (metric form) |
| Fat mass (at 21.1%) | 39.1 lb | 17.7 kg |
| Lean mass (at 21.1%) | 145.9 lb | 66.2 kg |
Before rounding, the two forms land 0.13 points apart (21.25% and 21.12%), far inside the method’s own error. The calculator converts inches to centimeters and runs the metric form, so both unit settings return the same number.
Military use today. As of 1 January 2026, the US military screens body composition by waist-to-height ratio (Human Performance Resources by CHAMP, Uniformed Services University, updated July 2026). DoD Instruction 1308.03 is being reissued. This page runs the 1984 research equation, so do not read your result as a pass or fail on any current service standard.
How to measure your neck, waist and height for an accurate result
Accurate body fat measurements need three readings taken the same way every time: the neck just below the larynx, the waist at the umbilicus, and height without shoes. Use a non-stretch tape measure, keep it level against the skin, and record each reading to the nearest half inch or centimeter. Measure in the morning before eating.
- Stand upright with arms relaxed, in bare skin or a thin shirt.
- Neck: wrap the tape just below the larynx (Adam’s apple), sloping slightly down toward the front. Snug, without pressing the skin in.
- Waist: measure circumference horizontally at the umbilicus, at the end of a normal breath out. Do not suck in.
- Height: barefoot, heels and back against a wall, eyes looking straight ahead.
- Take each reading three times and use the average.

Small taping slips move the number, and the two common ones both flatter you. In the worked example, the estimate drops 1.8 points if the waist is taped 1 inch smaller, and 0.9 points if the neck tape rides 0.5 inch higher over the Adam’s apple. Each extra inch of true waist adds about 1.7 points.
Mark the spot you tape.
How accurate is the Navy tape method?
For men, the Navy tape equation’s standard error of estimate is 3.52 percentage points against underwater weighing, measured in 602 Navy men aged 18 to 56 (Hodgdon & Beckett, 1984). Read a 20% result as roughly 16.5% to 23.5%. Against a four-compartment (4C) model in a later Navy sample, the error was 3.15 points (Hodgdon & Friedl, 1999).
If the errors are roughly normal, about two in three men land within one SEE of their reference value and about 95% within two. A 20% reading could therefore belong to a man whose lab value is 13% or 27%, though most sit far closer.
Bland–Altman limits of agreement add the direction of the error. Against 4C, the refitted equation read 0.8 points high on average (Hodgdon & Friedl, 1999). Against DXA it ran low: in 926 Army recruits it underestimated body fat at the start of training (Foulis et al., Frontiers in Physiology, 2023), and in 430 fit Marines it underestimated DXA body fat in men (Potter et al., Frontiers in Physiology, 2022).
Tracking change is weaker still. Over 8 weeks of basic training, DXA measured a 3.3-point fall in the men’s body fat, and the tape showed 2.2 (Foulis et al., 2023). If you are losing fat on a calorie deficit, expect the tape to understate the loss.
The 4C model is the reference because it measures fat, water, mineral and protein separately. Two-compartment methods assume lean tissue has a fixed density, and that assumption drifts with bone density and hydration, which differ between groups of men (Hodgdon & Friedl, 1999).

| Method | Reference and sample | Error for men | Source |
|---|---|---|---|
| Navy tape (Hodgdon–Beckett) | Underwater weighing, 602 Navy men | SEE 3.52 points | Hodgdon & Beckett, 1984 |
| Navy tape (DoD inch form) | 4C model, Navy sample | 3.15 points; reads 0.8 high on average | Hodgdon & Friedl, 1999 |
| Navy tape | DXA, 926 Army recruits | Underestimates body fat and fat loss | Foulis et al., 2023 |
| Research-grade BIA | DXA, 430 Marines | Mean difference +0.4 ± 3.2 points (age 30 or under); −0.5 ± 3.5 (over 30) | Potter et al., 2022 |
No tape-based tool can claim to be the most accurate body fat calculator. The useful question is how far off a given method is, and this calculator prints that answer next to your number so you can estimate body fat with its real margin.
Tape vs calipers vs smart scale vs DXA: which should you use?
Use the tape for a free baseline at home, skinfold calipers when one trained tester repeats the same sites, a smart scale only for trends under fixed conditions, and a DEXA scan when a medical decision depends on the number. Each step up costs more in time or money and gets closer to the 4C reference.
| Method | Cost | Where | Accuracy | What skews it |
|---|---|---|---|---|
| Navy tape | Free | Home | SEE 3.5 points | Tape angle, posture, waist landmark |
| Skinfold calipers | Low | Gym, certified personal trainer | Similar to tape with a skilled rater; about 120 practice tests to become proficient (HPRC) | Tester skill, site choice |
| Bioelectrical impedance analysis (smart scale) | Low to moderate | Home | Research-grade units averaged near DXA with a spread of 3.2–3.5 points; home scales vary by device (Potter, 2022; HPRC) | Hydration, recent meals, exercise |
| DEXA scan | $75–$80 self-pay at two US centers | Imaging center | Criterion method in the field studies above | Machine and software version |
| 4C model | Research budget | Research labs | Reference | — |
A body fat percentage scale for men sends a weak current between the feet and estimates fat from how fast it travels. Hydration changes that reading, so weigh at the same hour each time (HPRC).
DXA is the strongest option outside a lab. It also reports bone density and where fat sits, trunk versus limbs.
What your number means
Body fat levels for men are commonly graded on the American Council on Exercise scale: essential body fat 2–5%, athletes 6–13%, fitness 14–17%, average 18–24%, obese 25% or more. The bands apply to adult men of any age and ignore where the fat sits.
| Category | Men |
|---|---|
| Essential body fat | 2–5% |
| Athletes | 6–13% |
| Fitness | 14–17% |
| Average | 18–24% |
| Obese | 25%+ |
Age-adjusted ideal body fat percentages rise with age, so a healthy band at 65 sits higher than at 25 (Gallagher et al., Am J Clin Nutr, 2000).
Body fat percentage vs BMI
Body mass index (BMI) divides weight by height squared, so it cannot tell fat from muscle. Body fat percentage estimates composition. The two disagree most in muscular men, whom BMI labels overweight despite modest fat, and in men with a normal BMI who carry high fat. For one man, the two numbers can point opposite ways.
Two fictional men, both 5 ft 10 in:
- Man A, 205 lb, neck 17 in, waist 34 in. BMI 29.4 (overweight). Navy estimate 13.4%, the athlete band.
- Man B, 160 lb, neck 14.5 in, waist 37 in. BMI 23.0 (normal). Navy estimate 23.7%, near the top of average.
Man B shows normal-weight obesity, a pattern linked to cardiometabolic risk that BMI misses (Romero-Corral et al., European Heart Journal, 2010). Sarcopenic obesity is the older-man version. Skeletal muscle shrinks while fat grows, and BMI can stay flat for years (Donini et al., ESPEN–EASO consensus, Obesity Facts, 2022).
Military researchers reached the same view of short, muscular men, whom BMI tends to call overweight (HPRC). For the cut-offs themselves, see how BMI categories are defined.
Do women carry more body fat than men?
Yes. Women carry more body fat than men at every fitness level. On the American Council on Exercise scale, essential fat is 10–13% in women against 2–5% in men, because women store sex-specific fat in breast and pelvic tissue that supports reproduction.
| ACE category | Men | Women |
|---|---|---|
| Essential fat | 2–5% | 10–13% |
| Fitness | 14–17% | 21–24% |
| Average | 18–24% | 25–31% |
| Obese | 25%+ | 32%+ |
Compare men and women only against their own scale. A 22% reading is average for a man and lean for a woman.
The tape equations also differ by sex. Body fat for women is estimated with a separate Hodgdon–Beckett equation that adds a hip measurement, so the calculator switches formula when the sex toggle changes. Do not enter a woman’s measurements with the toggle set to male.
Your waist size and visceral fat
The waist you entered also screens for visceral fat, the fat packed around the abdominal organs. A waist-to-height ratio of 0.5 or higher flags raised cardiometabolic risk (Ashwell, Gunn & Gibson, Obesity Reviews, 2012). In the worked example, 36 ÷ 70 = 0.51, just over the line.
The NIH obesity guidelines treat a waist above 40 in (102 cm) in men as a marker of higher risk of type 2 diabetes and cardiovascular disease (NHLBI Clinical Guidelines, 1998). The Navy’s December 2025 fitness guidance screens sailors at a ratio of 0.55 (Military.com, January 2026).
A tape cannot split subcutaneous fat, which sits under the skin, from the deeper visceral layer. CT and some DXA software can. In the same meta-analysis, waist-to-height ratio predicted cardiometabolic risk factors better than waist size or BMI, so when your ratio sits above 0.5 and your body fat reads average, the ratio is the number to act on. Excess body fat around the organs carries health risks the total percentage hides.
Your waist-to-hip ratio, a second shape measure, comes with the body type calculator.
When to get a clinical body fat test — and who pays for it
Get a clinical test, usually a DEXA scan, when the number will change a medical decision: unexplained weight change, suspected muscle loss from age or illness, or a BMI that clearly conflicts with how a man looks and performs. For fitness tracking, the tape is enough.
Three triggers worth taking to a doctor:
- Weight stable or falling while the waist keeps growing.
- Over 60, with weaker grip, slower walking or falls.
- A drug, surgery or diet plan that will be adjusted based on fat or lean mass.
Most drug doses scale with weight or with body surface area, not body fat.
US medical records rarely hold a body fat number. Body-size diagnosis codes in ICD-10-CM sit in category Z68, and every adult Z68 code is one of the BMI ranges; the code set has no category for body fat percentage (CMS ICD-10-CM). That is why your chart shows BMI even after a DXA. Dr. Rabbani also runs Growth Partners Global, a US medical billing company, and the box below comes from published CPT guidance and payer policy.
Who pays for a body composition DXA
- CPT code: 76499, unlisted diagnostic radiographic procedure. CPT directs body composition DXA here; the DXA codes 77080–77086 cover bone density and fracture assessment (IKS Health, citing the CPT code book and CPT Assistant).
- Insurance: medical necessity decides, and several payers say it is not met. Blue Cross Blue Shield of Massachusetts lists whole-body DXA for body composition as investigational and not covered for its Medicare Advantage members; Premera calls the scan unproven.
- Self-pay price: $75 at SARA Radiology in Tucson and $80 at Wilmington Health in North Carolina, with no doctor’s order needed at the latter (provider price pages, October 2026).
A registered dietitian or your doctor can read the DXA report with you and turn fat and lean mass into a plan.
Method and sources
This calculator uses the Hodgdon–Beckett equation for men in its metric density form, converts density to fat with the Siri equation, and prints a ±3.5-point band from the published standard error of estimate. It gives an estimate for education only and is not medical advice.
- Hodgdon JA, Beckett MB. Prediction of percent body fat for U.S. Navy men from body circumferences and height. Report No. 84-11. Naval Health Research Center, San Diego; 1984.
- Hodgdon JA, Friedl KE. Development of the DoD body composition estimation equations. Technical Document 99-2B. Naval Health Research Center; 1999.
- Siri WE. Body composition from fluid spaces and density: analysis of methods. In: Techniques for Measuring Body Composition. National Academy of Sciences; 1961.
- Foulis SA, Friedl KE, Spiering BA, et al. Body composition changes during 8 weeks of military training are not accurately captured by circumference-based assessments. Front Physiol. 2023;14:1183836.
- Potter AW, Tharion WJ, Holden LD, et al. Circumference-based predictions of body fat revisited: preliminary results from a US Marine Corps body composition survey. Front Physiol. 2022;13:868627.
- Human Performance Resources by CHAMP (HPRC), Uniformed Services University. How the military measures body composition. Updated 27 July 2026.
- American Council on Exercise. Percent body fat norms for men and women.
- Gallagher D, Heymsfield SB, Heo M, et al. Healthy percentage body fat ranges: an approach for developing guidelines based on body mass index. Am J Clin Nutr. 2000;72(3):694–701.
- Romero-Corral A, Somers VK, Sierra-Johnson J, et al. Normal weight obesity: a risk factor for cardiometabolic dysregulation and cardiovascular mortality. Eur Heart J. 2010;31(6):737–746.
- Donini LM, Busetto L, Bischoff SC, et al. Definition and diagnostic criteria for sarcopenic obesity: ESPEN and EASO consensus statement. Obes Facts. 2022;15(3):321–335.
- Ashwell M, Gunn P, Gibson S. Waist-to-height ratio is a better screening tool than waist circumference and BMI for adult cardiometabolic risk factors: systematic review and meta-analysis. Obes Rev. 2012;13(3):275–286.
- National Heart, Lung, and Blood Institute. Clinical guidelines on the identification, evaluation, and treatment of overweight and obesity in adults. 1998.
- Military.com. Waist-to-height ratio now central to military body-composition standards. 1 January 2026.
- Centers for Medicare & Medicaid Services. ICD-10-CM, category Z68, Body mass index [BMI].
- IKS Health. Coding bone and joint studies (DXA body composition, CPT 76499).
- Blue Cross Blue Shield of Massachusetts. Medical policy 577, Whole body dual x-ray absorptiometry to determine body composition.
- Premera Blue Cross. Medical policy 6.01.528, DXA and bioelectrical impedance analysis to determine body composition.